Why a shared phone gives you nothing
A shared handset produces no data. You cannot see how long people waited, how many conversations you handled last Tuesday, which agent carried the load, or whether last month was better than the one before. You have the impression of whoever was closest to the phone.
This matters beyond curiosity. Without figures you cannot answer three operational questions: are we fast enough, are we staffed correctly, and is the thing we changed last month working. Every improvement becomes an argument about anecdotes.
The four figures that matter most
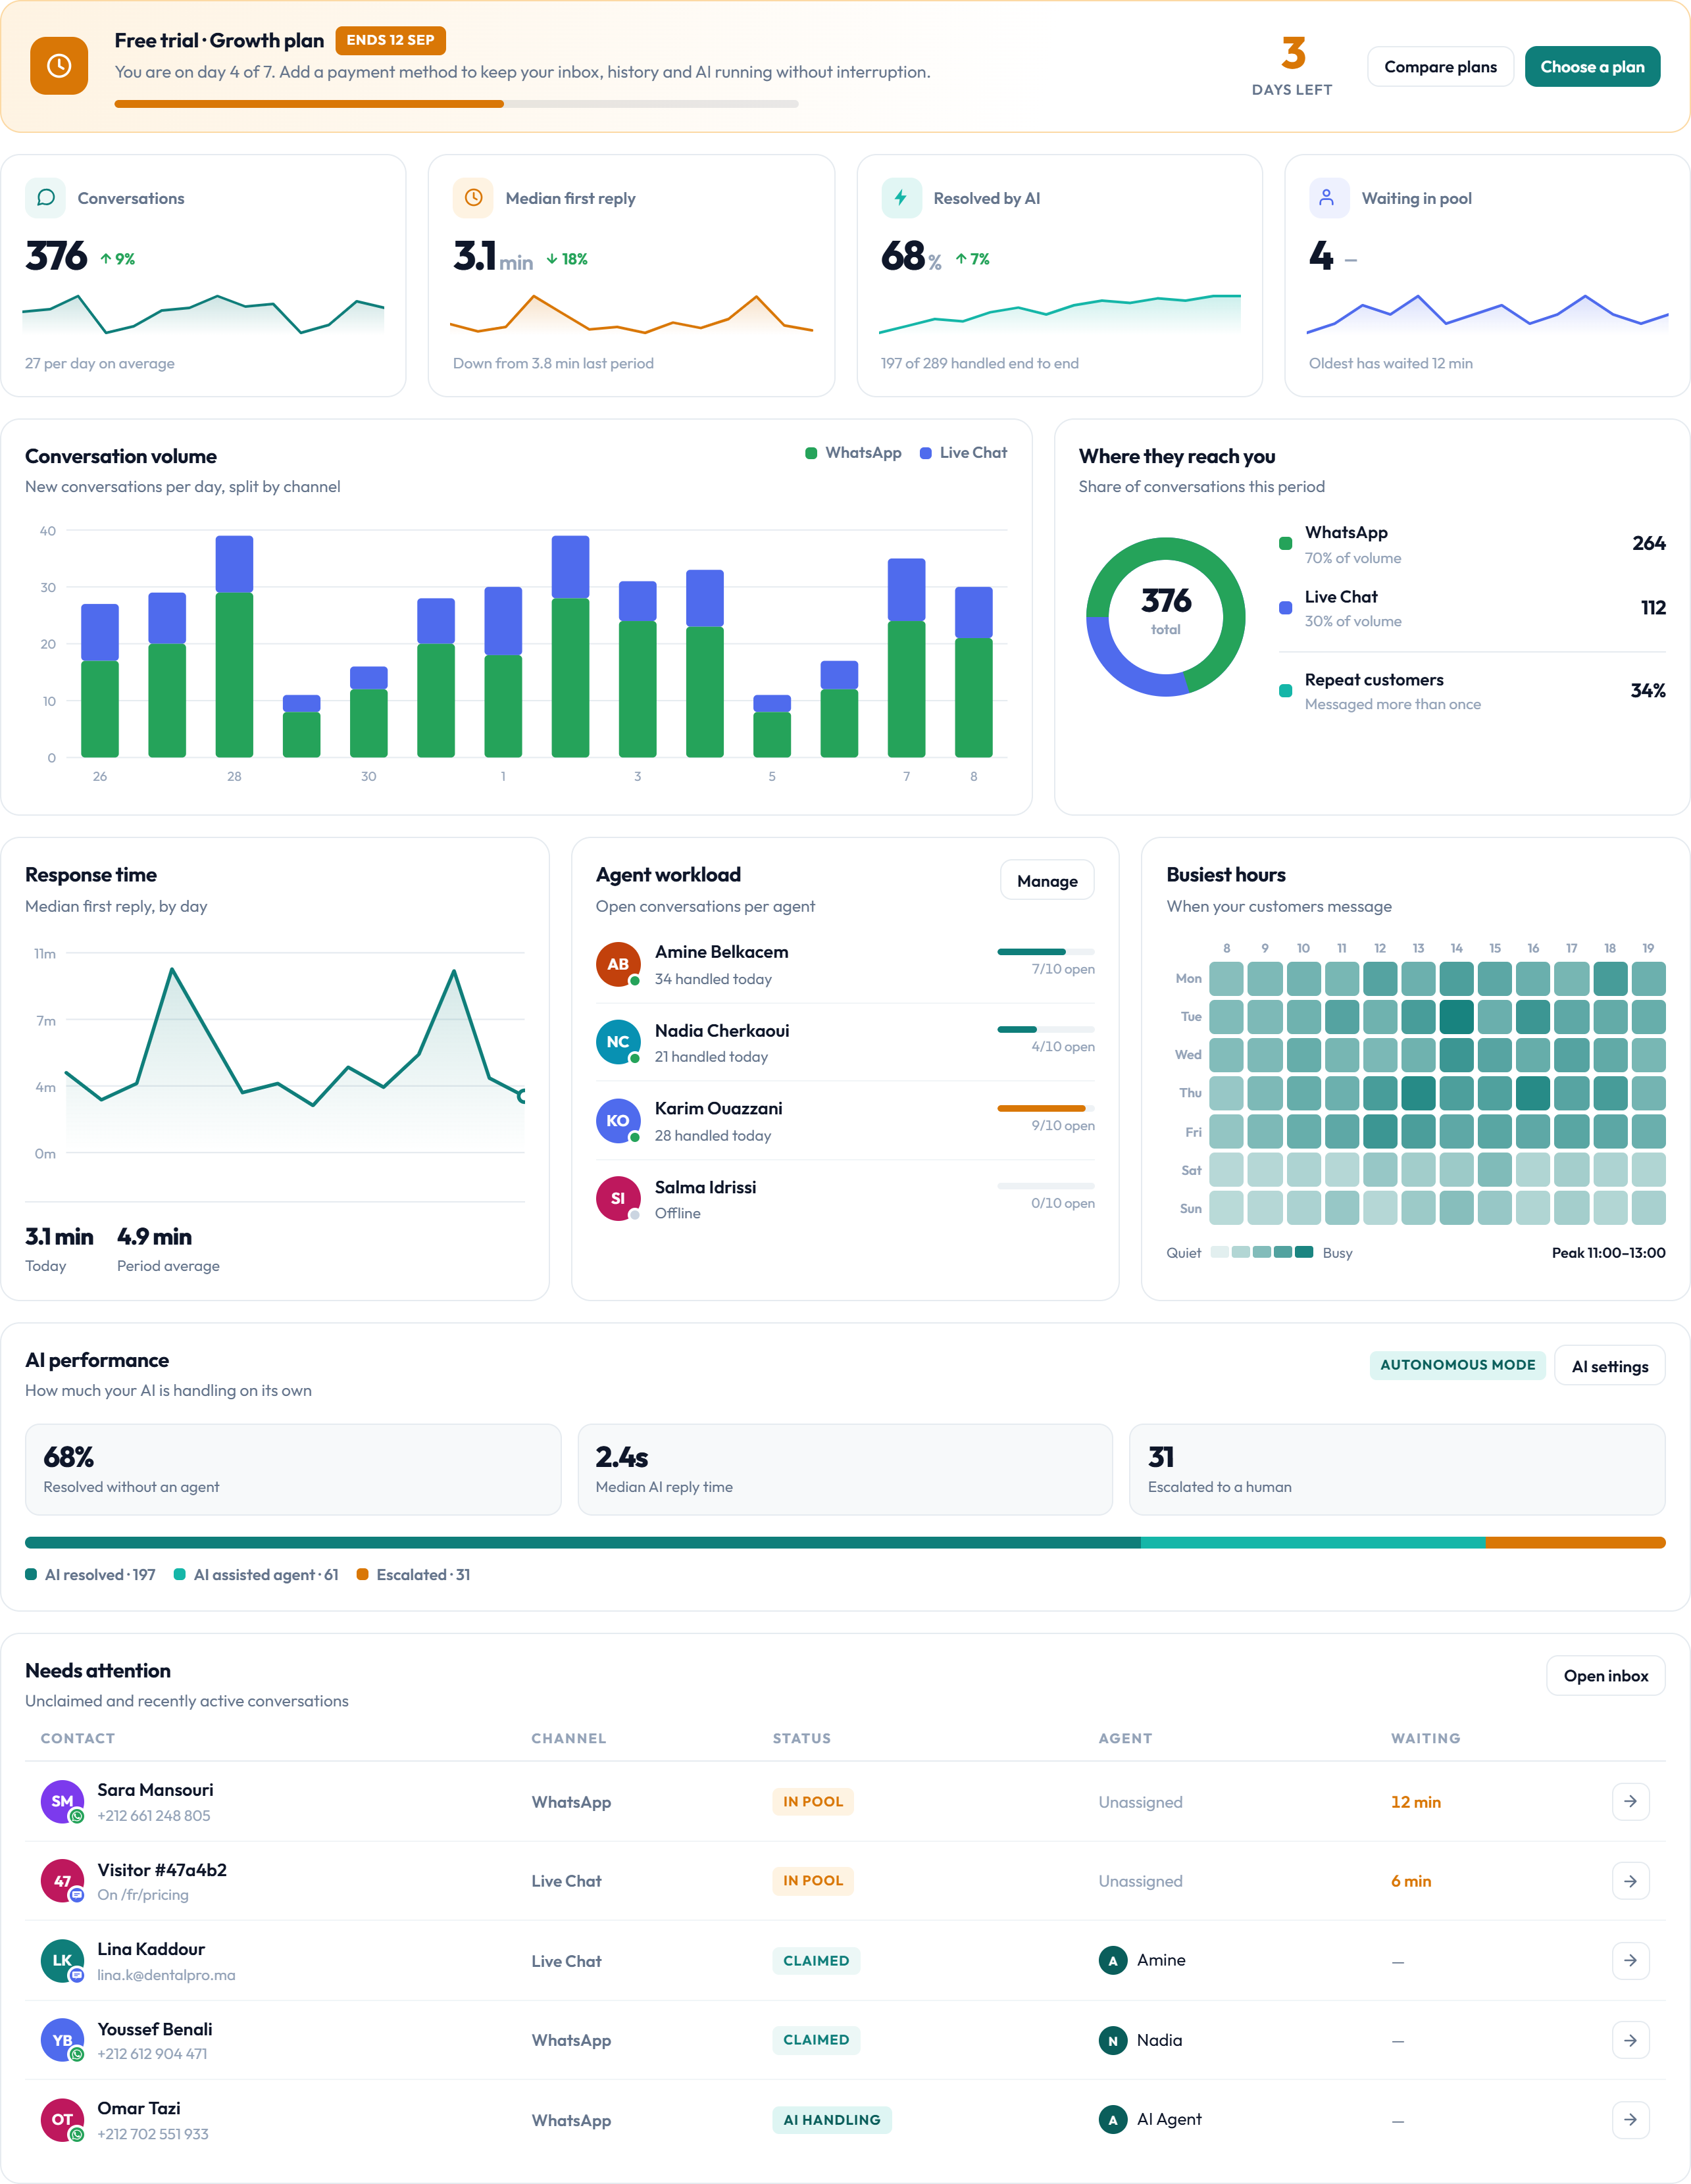
Reporting fails when it offers forty metrics and no priority. These four cover the operational picture, and the rest is diagnosis.

Median first reply
How long a customer waits for a human answer. Median rather than mean, because a handful of overnight conversations will drag an average into meaninglessness. This is the number customers actually experience.
Conversation volume
How much is arriving, split by channel. Its value is comparative — this week against last, this month against last — and it is the input for every staffing decision.
Resolved by AI
The share of conversations closed without a human. This is the automation dividend, and the honest measure of whether your knowledge base is doing work.
Waiting in pool
How many conversations are unclaimed right now, and how long the oldest has waited. The only real-time number in the set, and the one to watch during a shift.
A median first reply of four minutes is excellent for some businesses and poor for others. What matters is whether it is moving the way you intended.
Volume and channel mix
Volume by day and channel answers the staffing question, and channel mix tells you where your customers are actually choosing to reach you — which is frequently not where you assumed.
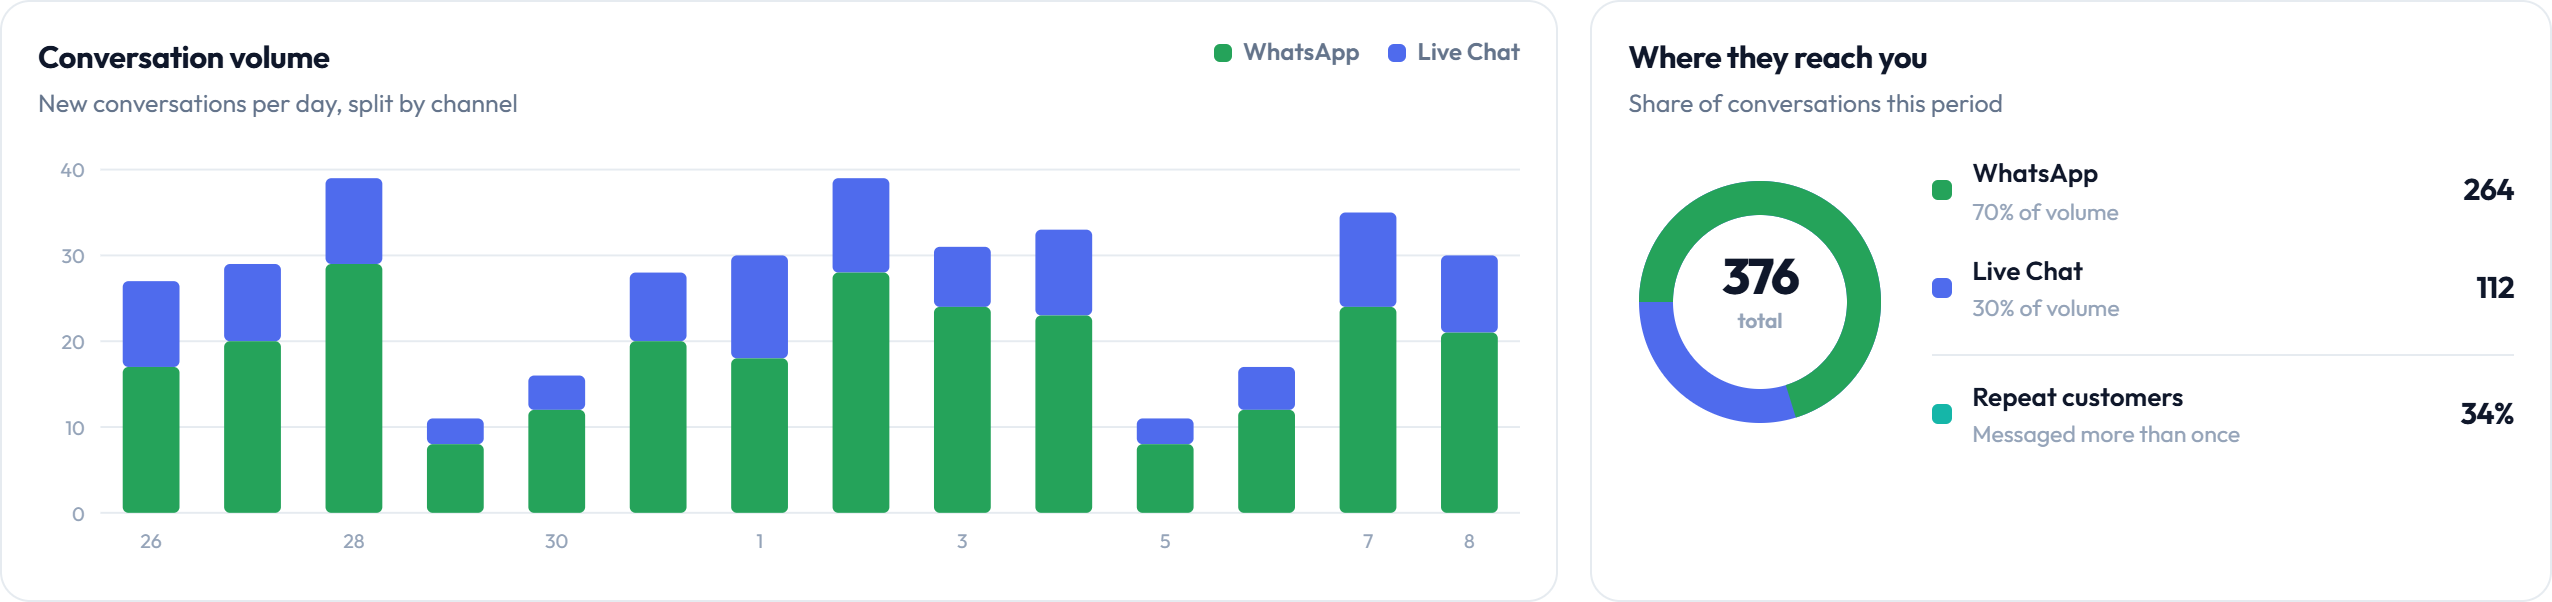
Two patterns worth acting on. If website chat volume is high relative to WhatsApp, your pre-sales traffic is bigger than your support traffic and autonomous AI on the widget will pay off quickly. If repeat-customer rate is high, your knowledge base is the highest-leverage thing you can improve, because the same people are asking the same things.
Response and resolution time
First reply and resolution are different problems with different fixes. Confusing them leads teams to hire when they should be automating, or vice versa.
| Symptom | Usual cause | What to change |
|---|---|---|
| Slow first reply, fast resolution | Nobody is watching the queue at that hour | Shift coverage, or autonomous AI for first response |
| Fast first reply, slow resolution | Agents acknowledge then get stuck | Knowledge gaps, or escalation paths that dead-end |
| Both slow | Understaffed for the volume | Headcount, or deflect more with AI |
| Weekend spike in both | No weekend cover | Autonomous AI out of hours, or a monitored queue |
The response-time chart plots the median by day, so a weekend or a shift gap shows up as a shape rather than a suspicion.
Agent workload and busiest hours
Two questions here: is work distributed fairly, and does your coverage match when volume actually arrives.
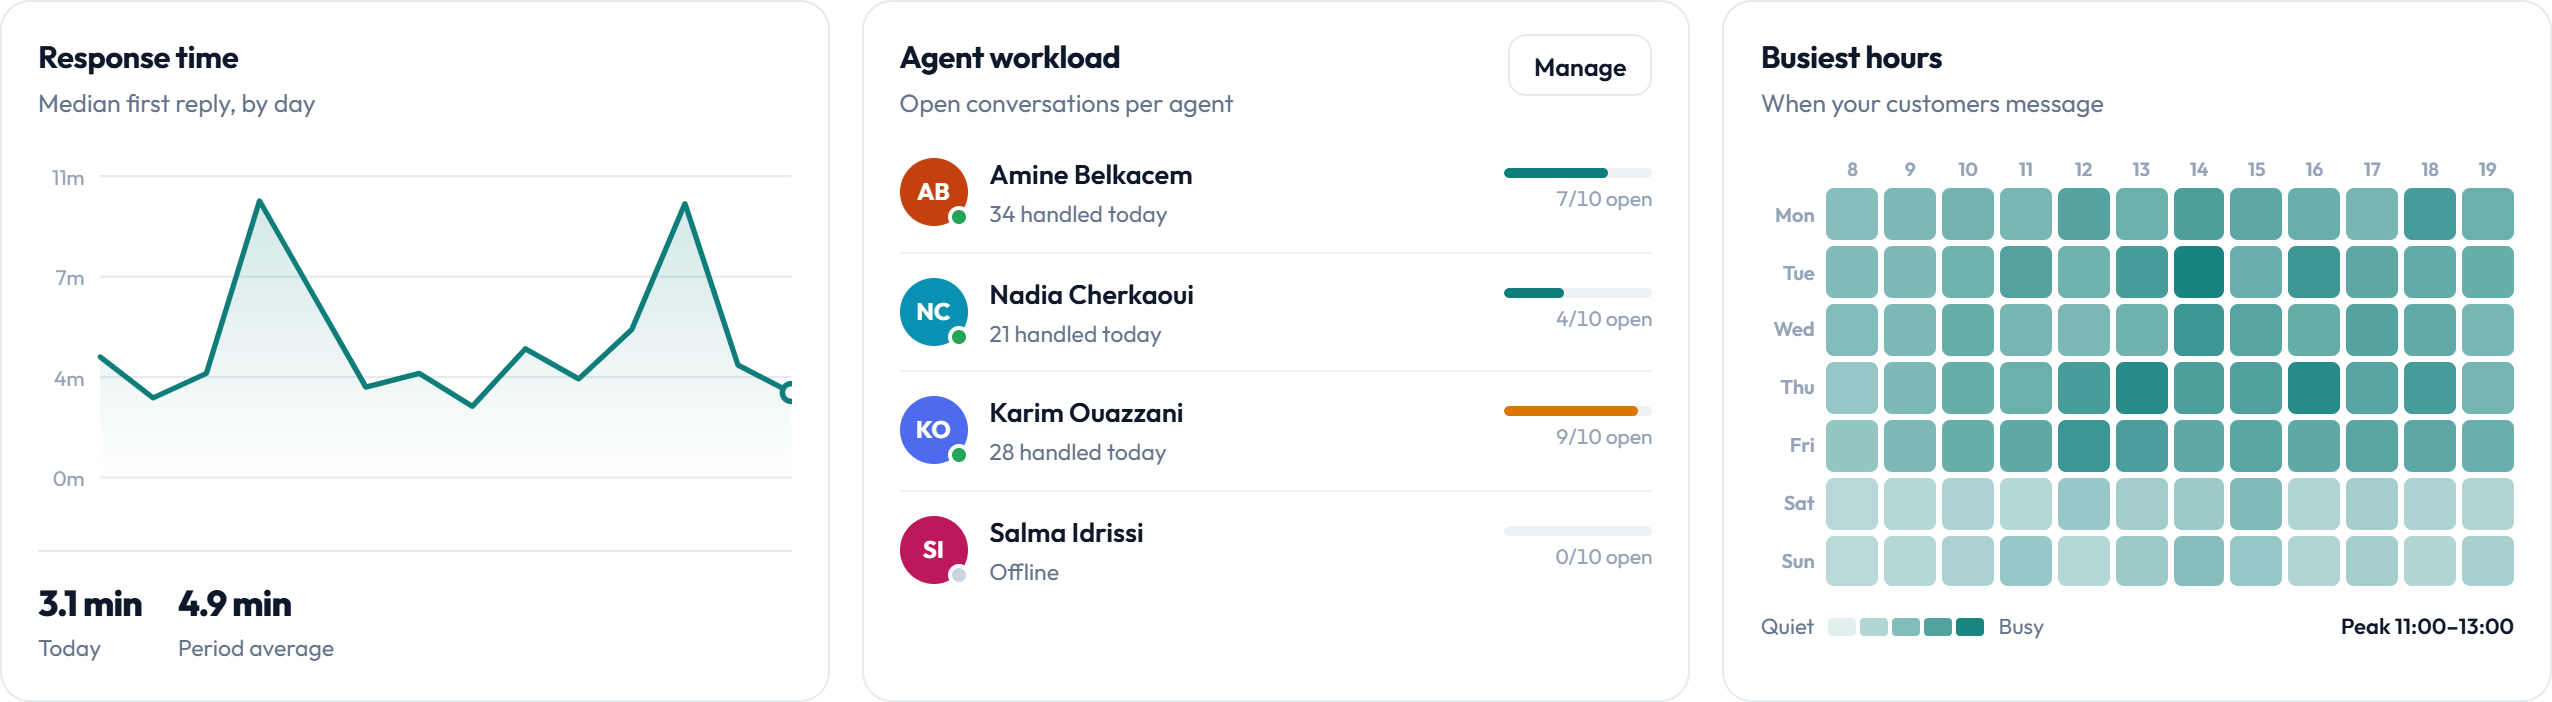
The workload panel shows open conversations per agent against a capacity figure, with the bar turning amber past 80%. Persistent imbalance is usually a routing problem rather than an effort problem — one queue is absorbing more than its share.
The heatmap is the more actionable of the two, because it is the one people get wrong from intuition. Teams routinely staff evenly across the day when volume is concentrated in a three-hour window. Comparing the heatmap against your rota is often the single cheapest response-time improvement available.
AI performance
AI reporting should answer one question: how much work is it taking off your team, and is it handing over the right things?

Deflection rate is the headline. The stacked bar below it separates conversations the AI closed entirely, ones where it drafted and an agent sent, and ones it escalated. Escalations are a healthy category — a deflection rate of 100% would mean the AI is answering things it should be handing over.
Using this in a weekly review
Reporting only changes behaviour if somebody looks at it on a schedule. A fifteen-minute weekly review covers it.
- Median first reply against last week. If it moved, find the day it moved on.
- Volume against last week, and whether any change was staffing or demand.
- The busiest-hours heatmap against your actual rota.
- Deflection rate, and the top three recurring escalation topics — these are your next knowledge base entries.
- Agent load balance, and whether any imbalance is routing rather than effort.
The escalation topics are the most valuable item on that list, because they convert directly into automation. Every gap closed is a category of question that stops reaching a human.
Frequently asked questions
Which metrics are included?
Conversation volume by channel and day, median first reply, resolution time, conversations waiting in the pool with the oldest wait, per-agent workload against capacity, busiest hours by day and hour, and AI deflection split into resolved, assisted and escalated.
Is reporting available on every plan?
Core volume, response-time and AI reporting are available on all plans. Per-team breakdowns and the fuller reporting set come with Growth and above.
Why median first reply and not average?
A small number of conversations that arrive overnight and are answered in the morning will drag an average into meaninglessness. The median reflects what a typical customer actually experiences.
Can I export the data?
Yes. Reports can be exported for the period you select, so you can combine them with other business data or keep a longer history outside the workspace.
Does the AI count as an agent in workload reporting?
No. AI activity is reported separately as deflection, so human workload figures are not flattered by automated replies.
How far back does history go?
Your full workspace history is retained and reportable. The dashboard defaults to the last 14 days, with 7 and 30-day views selectable.